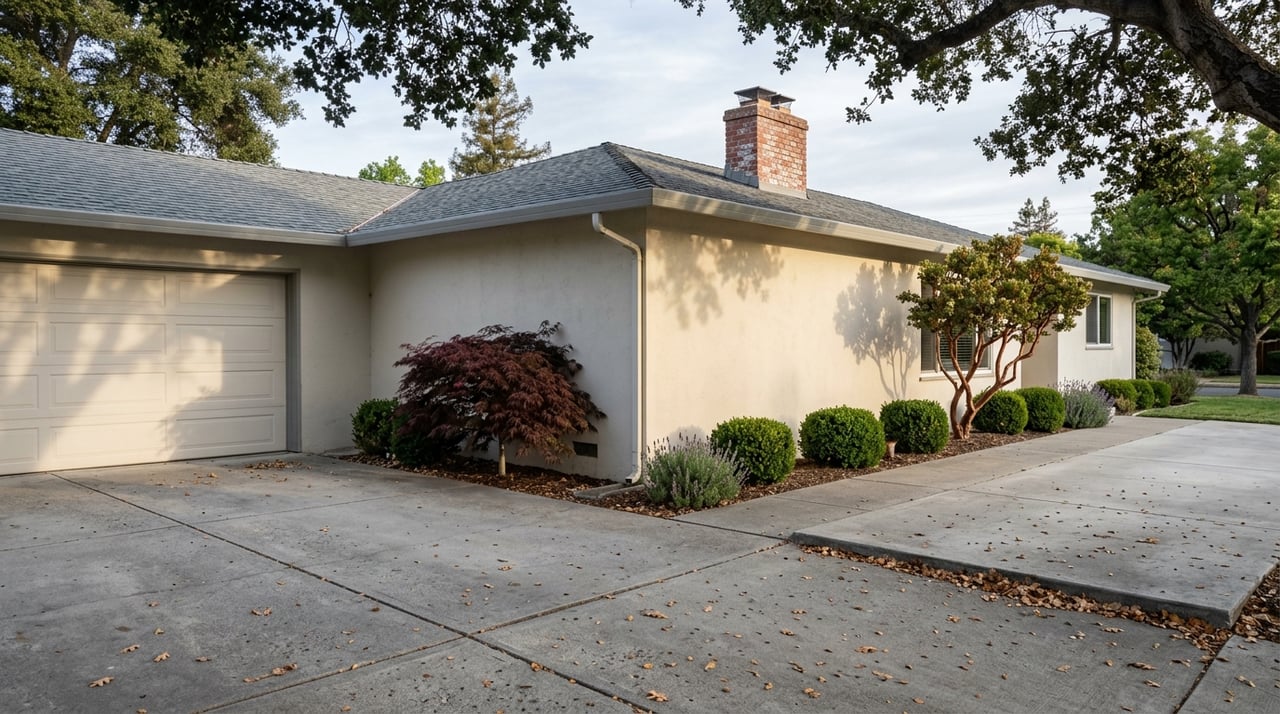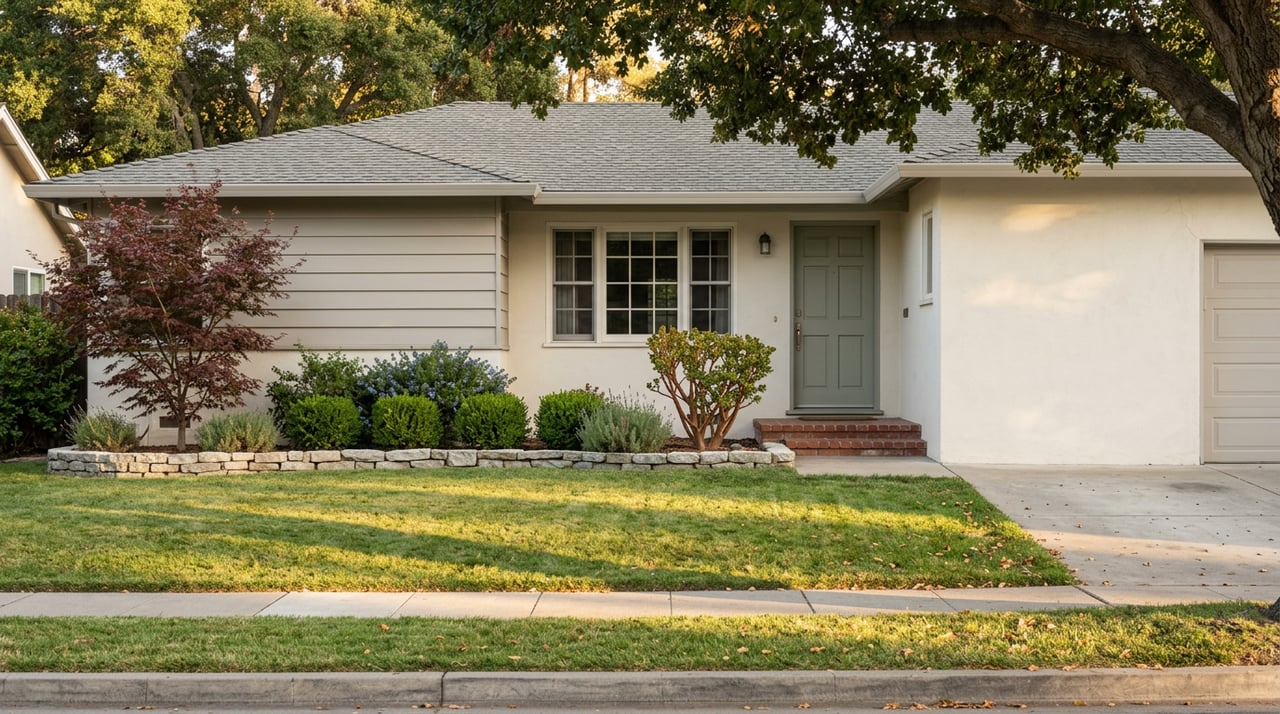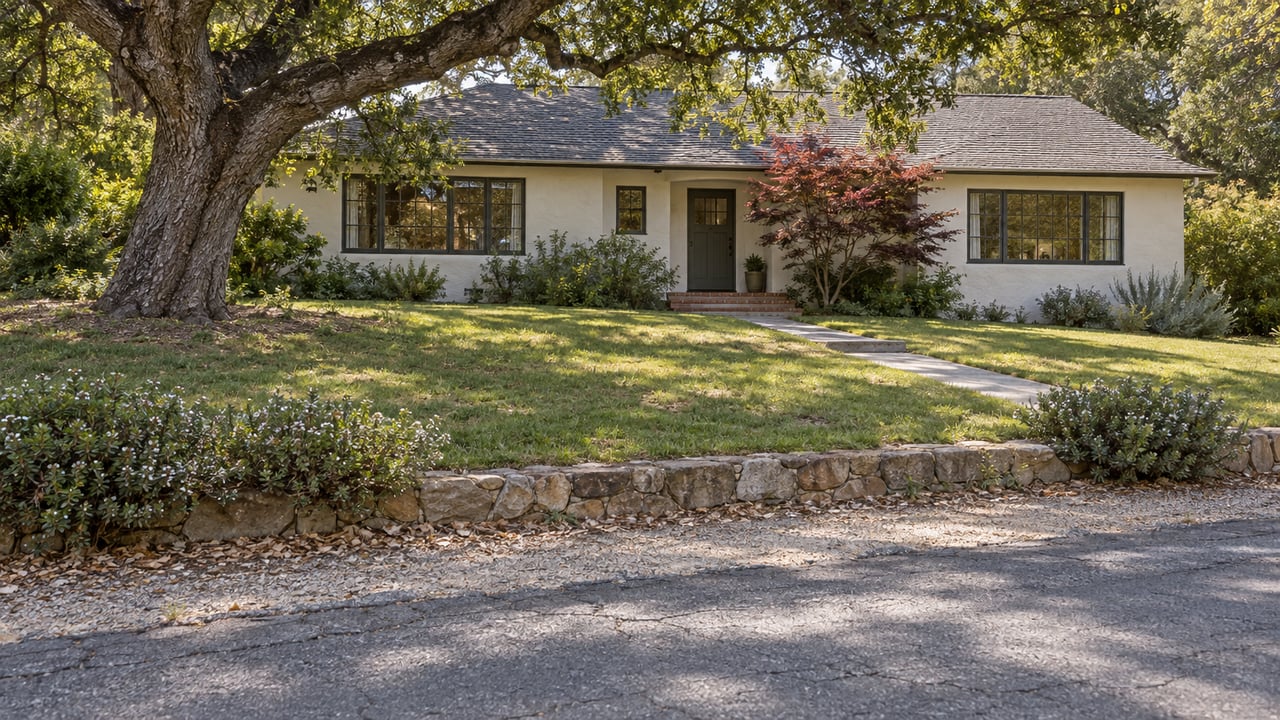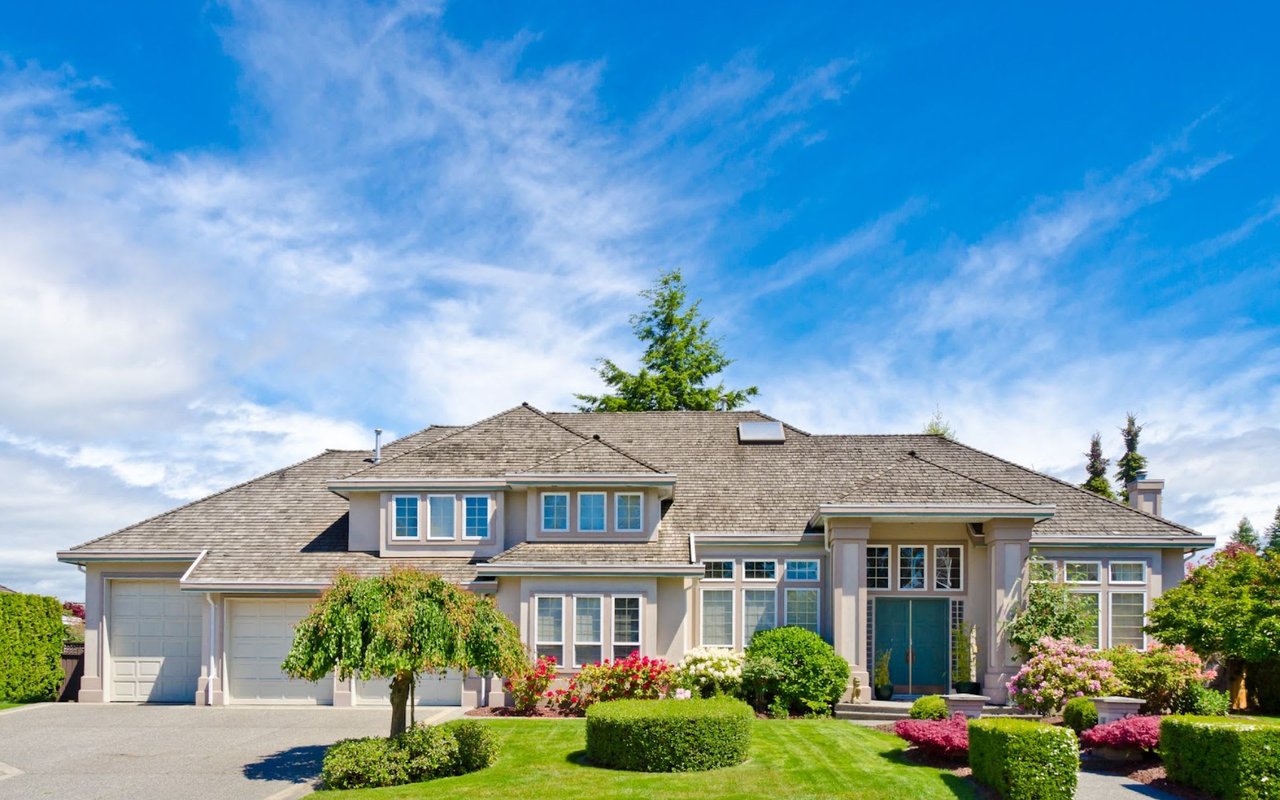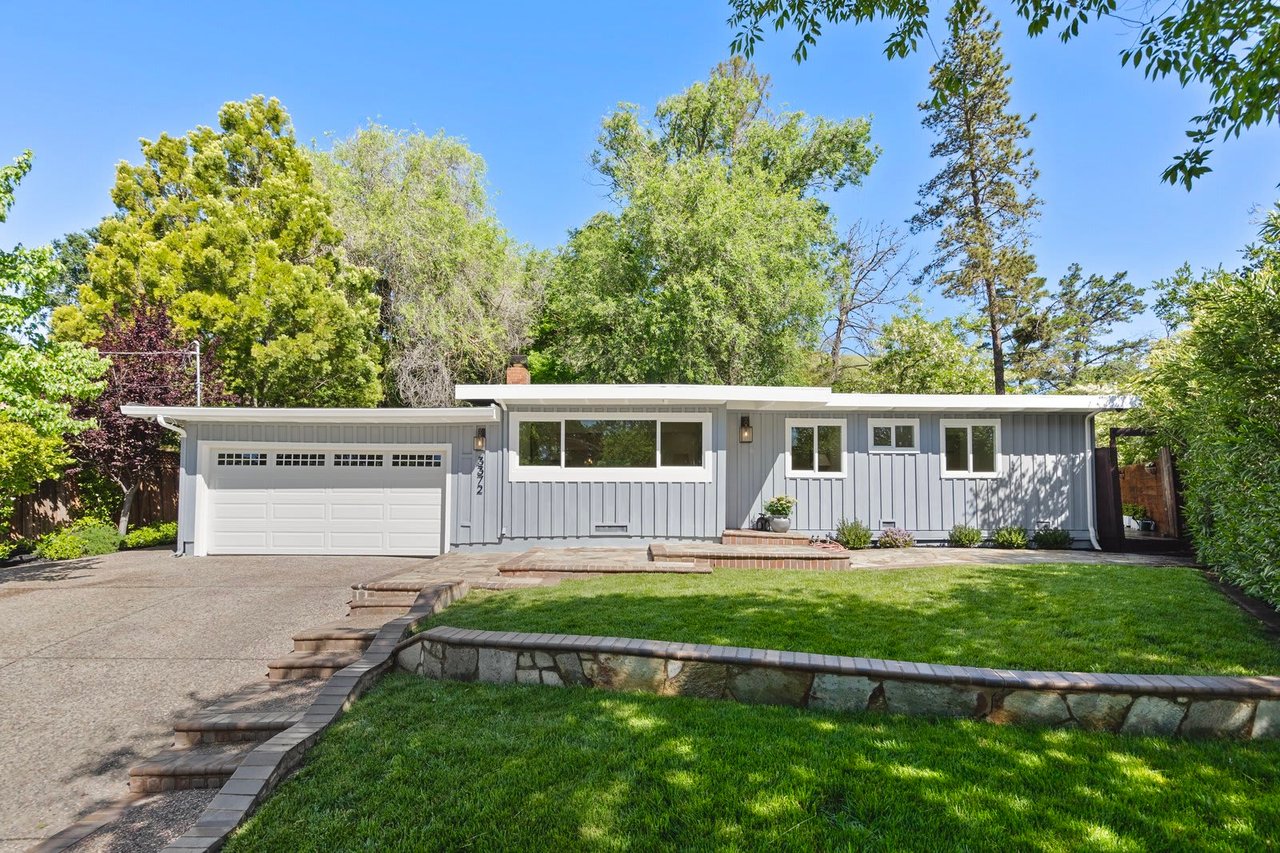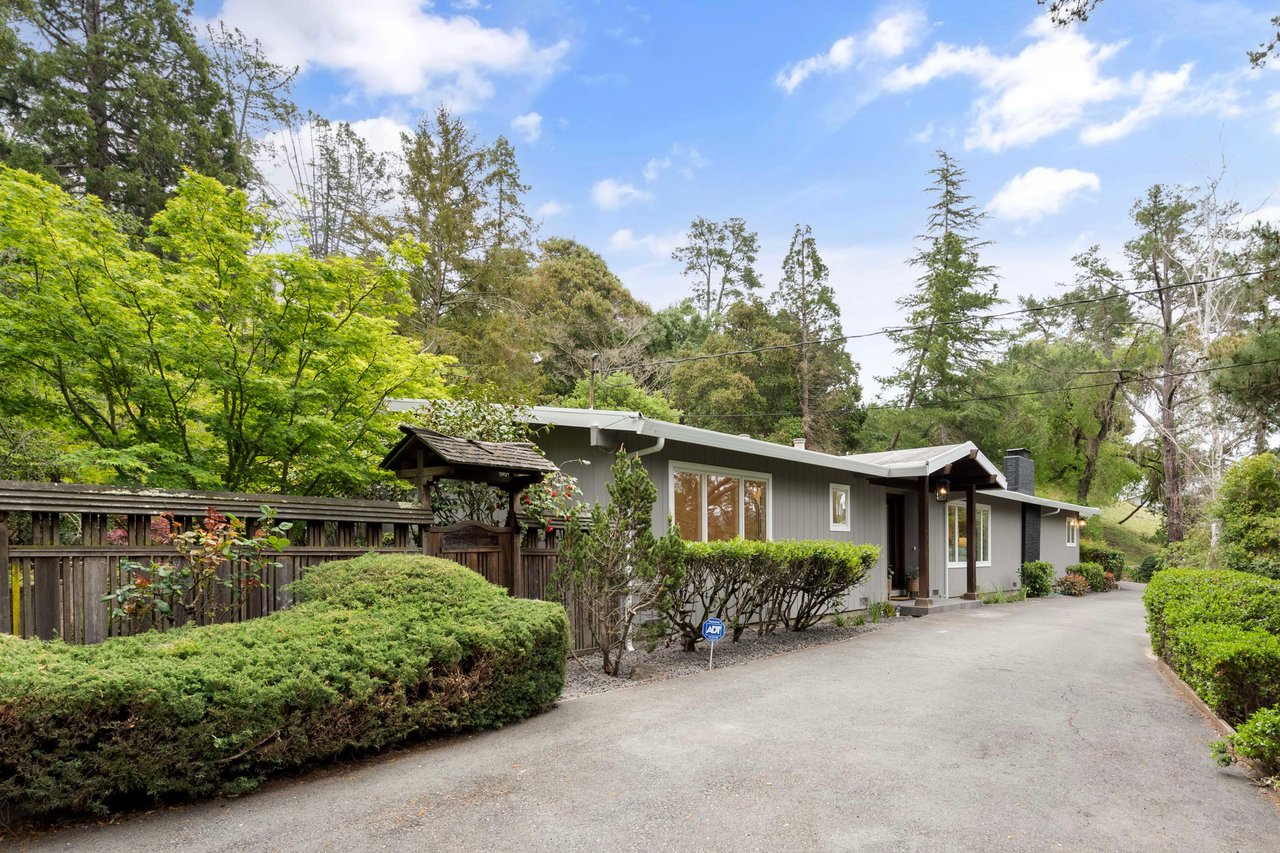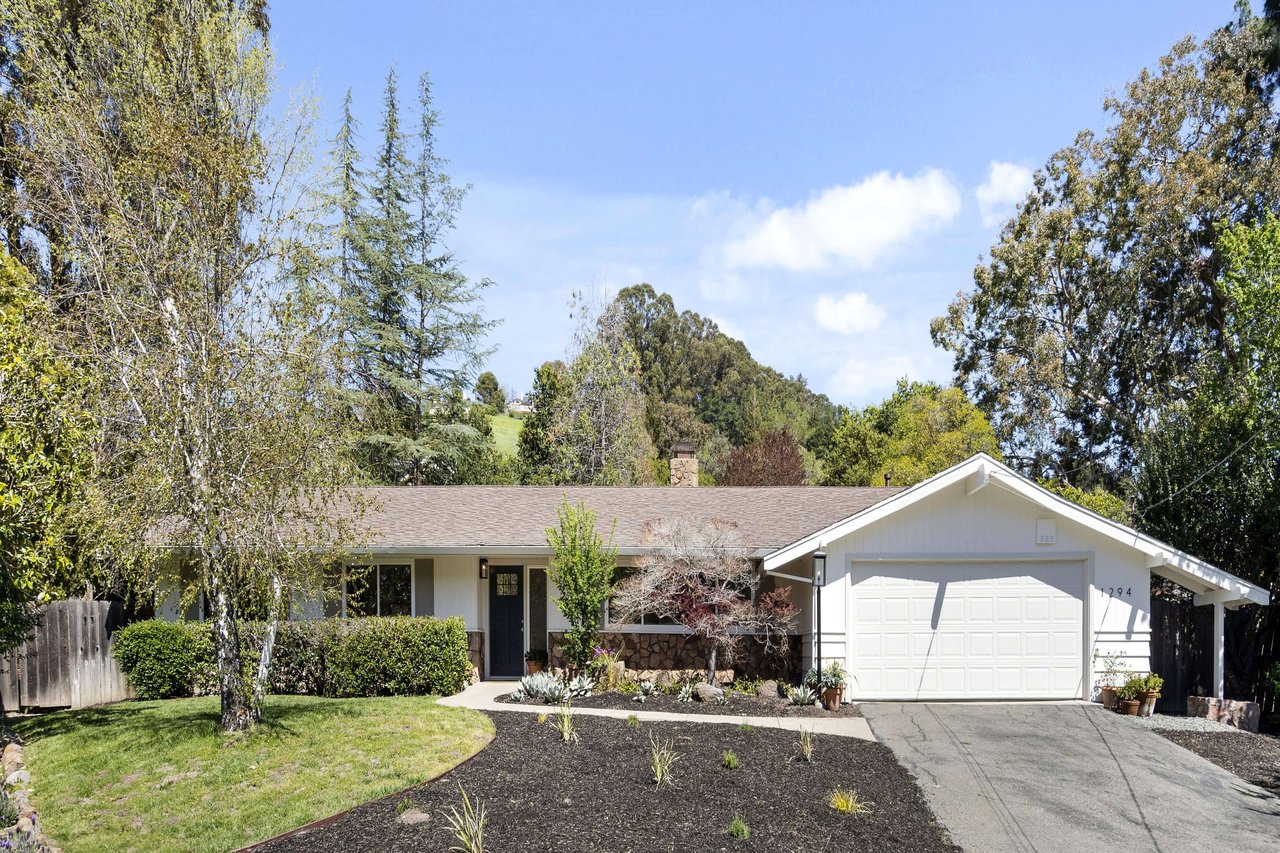
On July 15, 2026, the county recorded the sale of 7 Haciendas Road in Orinda for $9,950,000. The house is a 1957 four-bedroom with 9,082 square feet, and its last recorded sale was in 1988 for $397,500, according to Lamorinda Weekly's recorded-sales listing. Five weeks later, on August 19, 8 Camino Lenada was recorded at $9,000,000. That one is a 1928 house with nine bedrooms and 7,987 square feet, as reported in the paper's October 14 listing.
Those two recordings go a long way toward explaining the headline number. In the third quarter of 2026, Orinda's average single-family sale price was $2,378,031. A year earlier it was $2,031,605, so the gain was about 17%. Those figures come from Contra Costa Association of Realtors data reported in Lamorinda Weekly's Q3 quarter review. If you're comparing towns and looking at that average, you'd conclude Orinda pulled away from the pack this summer. The other numbers in the same report point the opposite direction.
What the rest of Orinda's third quarter looked like
From July 1 through September 30, 2026, Orinda closed 53 single-family sales, compared with 64 in the same quarter of 2025. Homes took an average of 29 days to go pending. The average sale came in at 98.5% of final asking price, down from 99.3% a year earlier. Only 26 of the 53 sales closed at or above final asking.
That last number is the one that matters if you're writing an offer. In Q3 2026, roughly half of Orinda sales closed below the final list price. Lamorinda Weekly measures sale-to-list against the final asking price, so any price cuts made before the sale are already built into the ratio. A home that came on the market high, got reduced and then sold below its reduced price shows up in that figure only as the last step.
Orinda's Q3 sale prices ran from $795,000 to $9.95 million. In a quarter with 53 sales, a spread that wide gives the top end a lot of pull on the average.
Taking the two biggest sales out of the average
Here's the arithmetic. It assumes both recorded sales are among the 53 closings in the CCAR count. County recording dates and MLS closing dates don't always match exactly, so treat the result as close, not precise.
- 53 sales × $2,378,031 average = about $126.0 million in total Q3 sales volume.
- Subtract the two recorded sales, $9,950,000 and $9,000,000, or $18.95 million combined.
- That leaves about $107.1 million across 51 sales.
- $107.1 million ÷ 51 = roughly $2.10 million.
On that basis, the other 51 sales averaged about $2.10 million, around 3% above the year-earlier quarter's $2,031,605. That's a modest gain. A 17% headline that falls to about 3% once two transactions are removed tells you more about how few homes trade in Orinda than about how prices moved.
Price per square foot moved the other way
Price per square foot is harder for one large house to distort. In Q3 2026, Orinda detached homes sold at an average of $746.18 per square foot, compared with $755.76 a year earlier.
The two big sales make that decline look even sharper. 7 Haciendas Road works out to about $1,096 per square foot, and 8 Camino Lenada to about $1,127. Both are well above the quarter's average. Taking them out would lower the per-square-foot figure for the rest of Orinda's Q3 sales, not raise it. Excluding those two, the typical Orinda home this summer sold for slightly less per square foot than it did a year earlier and for less than its final asking price about half the time.
The same spread shows up street by street
The recorded sales show why the average says so little about any one house. These are Orinda single-family recordings from July through early September 2026 in Lamorinda Weekly's September 9 and October 14 listings. The per-square-foot column is simple division.
| Address | Price | Sq Ft | Year Built | Approx. $/Sq Ft |
|---|---|---|---|---|
| 38 Fiddleneck Way | $3,050,000 | 2,736 | 2021 | $1,115 |
| 30 Greenwood Court | $3,495,000 | 4,135 | 2003 | $845 |
| 24 Las Vegas Road | $1,598,000 | 2,021 | 1949 | $791 |
| 130 La Espiral | $2,000,000 | 2,559 | 1970 | $782 |
| 7 El Corte | $1,450,000 | 2,002 | 1953 | $724 |
| 1 Gardiner Court | $3,570,000 | 5,755 | 1990 | $620 |
| 163 El Toyonal | $1,360,000 | 2,295 | 1973 | $593 |
| 135 Canon Drive | $1,250,000 | 2,393 | 1965 | $522 |
The 2021 house on Fiddleneck Way sold for $3.05 million, and the 1990 house on Gardiner Court sold for $3.57 million. Their prices are about half a million dollars apart, yet the newer, smaller house brought nearly twice as much per square foot. From a builder's point of view, that gap is mostly about condition, systems and how recently the house was built or reworked. Those are the factors a town-wide average averages away, and they're the ones that decide what a specific Orinda house is worth.
Spring to summer, across three towns
The year-over-year comparison is only part of the picture. The bigger change happened between June and September of this year. Q2 2026 figures come from Lamorinda Weekly's second-quarter review.
| Town | Q2 2026 $/Sq Ft | Q3 2026 $/Sq Ft | Q2 2026 Sale-to-List | Q3 2026 Sale-to-List | At/Above Asking, Q3 2026 |
|---|---|---|---|---|---|
| Orinda | $831.56 | $746.18 | 103.2% | 98.5% | 26 of 53 |
| Lafayette | $913.16 | $835.62 | just over 103% | 101% | 52 of 84 |
| Moraga | $870.09 | $817.84 | 101.6% | 102.9% | 18 of 29 |
In Q2 2026, Orinda was the strongest of the three on sale-to-list: 44 of its 64 sales closed at or above asking, and homes went pending in an average of 18 days. By Q3 it was the only one of the three towns where the average sale closed below final asking. Moraga was the strongest. In Q3 2026, 18 of its 29 sales closed at or above asking, compared with 11 of 27 a year earlier. Average marketing time fell to 22 days from 41, and price per square foot rose to $817.84 from $787.07. Lafayette moved the way the obvious story would predict. Sales rose to 84 from 71, while the average price fell to $2,112,426 from $2,218,412.
Fewer listings and softer prices at the same time
Orinda's supply was tight through the whole period. As of July 3, 2026, Orinda had 31 homes on the market, compared with 60 a year earlier. As of October 6, it had 33, compared with 56. Usually, when available homes drop by about 40% from a year earlier, buyers end up bidding over asking. In Orinda this summer, the sale-to-list ratio went down instead.
In the Q3 review, Conrad Bassett of Lamorinda Weekly gave this explanation:
"This is likely a factor of a rise in interest rates and of sellers realizing that they needed to be more realistic in pricing and buyers understanding that there were fewer buyers to compete with so they were not as aggressive in their offers."
The rate side of that is easy to confirm. The California Association of Realtors' September 2026 release put the average 30-year fixed rate at 6.86% in September, compared with 6.35% in September 2025. Bassett also points to owners holding mortgages at 3% or less who don't want to give them up for rates of 7% or more, which keeps supply low. Put those together and you get fewer sellers and fewer active buyers simultaneously. A thin market like that can produce low inventory and softer prices in the same quarter.
The same report draws a regional contrast. Bassett writes that "teaser pricing," where a home is listed well below its expected value to draw multiple offers, "is not as prevalent in Lamorinda." In Piedmont, the average Q3 sale closed about 25% above asking. In Orinda this fall, a list price has generally been a realistic number, and about half the time this summer it turned out to be the high end of what buyers paid.
What this means for an offer or a list price this fall
If you're buying in Orinda, Q3 2026 doesn't support starting from the assumption that you'll need to go well over asking. That assumption came from spring, when Orinda sold at 103.2% of final asking. Look at how long the home has been listed, check its price per square foot against comparable houses of similar age and condition, and let those numbers set your offer.
If you're selling in Orinda, the 17% headline gain doesn't describe your house unless it's one of the very few at the top of the market. The comparison that matters is per-square-foot results for similar houses, with condition taken into account, and those were flat to slightly down this summer.
If you're choosing between towns, Q3 2026 made Moraga the most competitive of the three on sale-to-list, and Orinda the one where a buyer had the most room to negotiate on price.
Bassett notes that seven of the 47 pending sales across the three towns went into contract in the first six days of October. That's about one a day, so homes are still moving as the year winds down.
FAQ
Why does Lamorinda Weekly report averages, not medians? Its quarterly reviews of CCAR data give average sale price, average price per square foot and average sale-to-final-list ratio for each town. With 29 to 84 sales per town in a quarter, one or two very high sales can move an average a lot, which is why per-square-foot and sale-to-list figures are useful alongside it.
Did Orinda prices fall? On a per-square-foot basis, slightly. Q3 2026 averaged $746.18, compared with $755.76 in Q3 2025, and was down from $831.56 in Q2 2026.
Are high-end Orinda homes still selling? Yes. Across the three towns combined, 23 homes closed above $3 million in Q3 2026, compared with 18 a year earlier. As of October 6, 18 homes were listed above that level, compared with 28 a year earlier.
If you'd like to know where your Orinda house falls in this spread, the Paddy Kehoe Team can price it the way this post does. We look at per-square-foot results for homes of similar age and condition, and we account for the systems and finish work that separate a $600-per-foot house from a $1,100-per-foot one. Schedule a free Home Strategy Session.